Cash timing, not just cash level.
And the one question no dashboard can answer: why is the forecast worse than Monday?
Cash timing
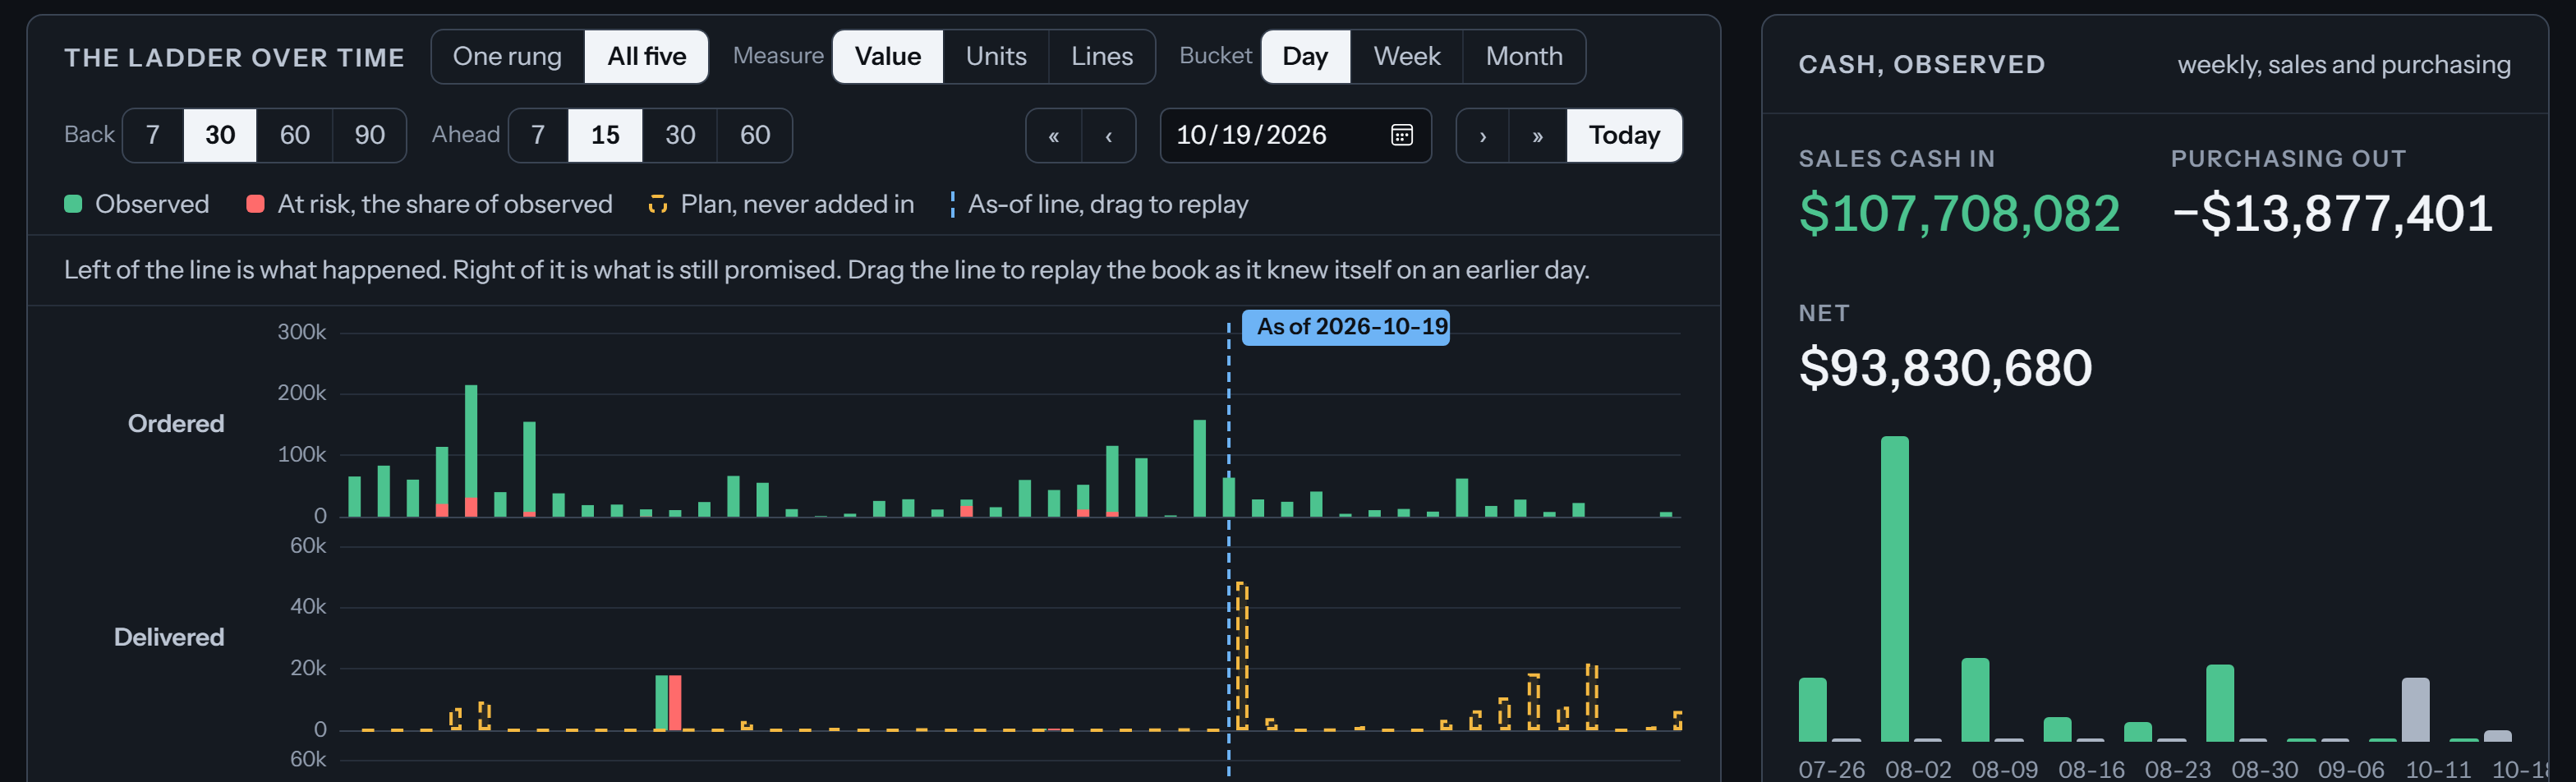
Knowing your cash balance is easy. Knowing when cash will land, and how sure you are, is what a CFO actually needs. The Business Ledger shows money coming in from customers and going out to vendors, laid out forward in time, each piece with a confidence that moves as SAP moves.
The delta
A dashboard shows you a number. When the number gets worse, it cannot tell you why.
The ledger keeps every change as an entry. So you can compare any two moments and see exactly what moved: which orders slipped, which payments came late, which holds were applied, and who or what caused each.
"Why is the forecast worse than Monday, and who caused it?" is a question the ledger answers directly.
Ask why three times
A CFO asks why three times. The first answer is a customer. The second is an order. The third has to be a real SAP document you can open. In the Business Ledger it is.
Both sides of cash
Receivables and payables sit in the same ledger, so cash in and cash out are read together, not stitched together.
What this is, and is not
It is a fast, honest view of what is likely to happen to cash and why.
It is not your financial close. The forecast is management information. What has actually happened is SAP's own values, drillable to the document.
See it
Start with the data. Add the answers when you want them.
And the one question no dashboard can answer: why is the forecast worse than Monday?