
Finance

When cash lands, and what moved.

The questions

  • When will cash actually arrive, and how sure are we?
  • Why is the forecast worse than Monday?
  • Which customers and vendors are moving cash the most?
  • Where does this number come from? Show me the SAP document.

What you get

With Roundhouse: your SAP financial data, in real time, in the lake or warehouse your analysts already use. Accounts payable, accounts receivable, general ledger, ACDOCA.

With the Business Ledger too: cash timing laid out forward, the delta since any earlier moment, and every number drilling to the SAP document.
Why is the forecast worse than Monday? Two cash forecast lines over the next eight weeks. The line from Monday is higher than the line from now. The gap between them is shaded and explained on the right: three orders slipped a week, one customer payment came late, one credit hold was applied. W1 W2 W3 W4 W5 W6 W7 W8 Next eight weeks Cumulative net cash Forecast as of Monday Forecast now Moved since Monday 3 orders slipped by a week 1 payment from a customer, late 1 credit hold applied to an account each opens in SAP
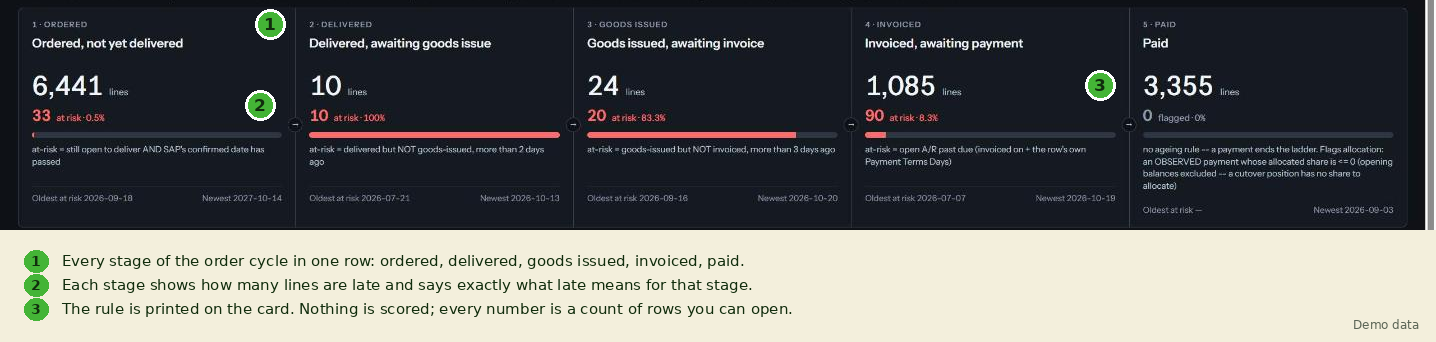
Five order-cycle stages with how many lines are late at each
The order cycle in one row
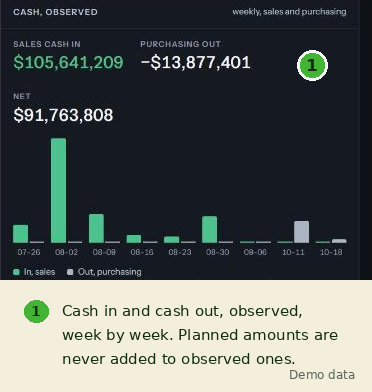
Cash in and cash out by week
Cash, week by week

Not your close

The forecast is management information, for decisions this week. What has happened is SAP's own values, drillable to the document.
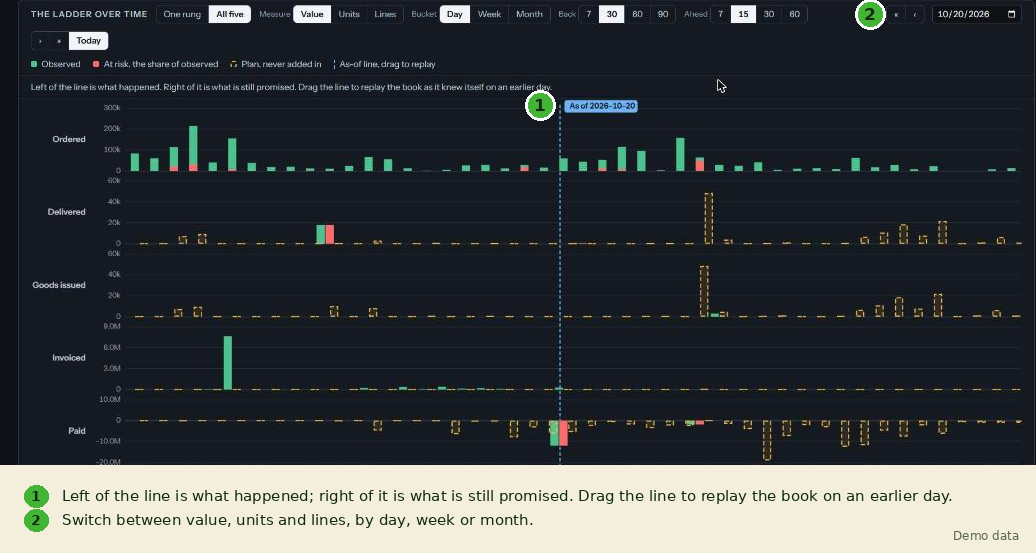
A timeline of orders, deliveries, goods issues, invoices and payments, with an as-of line to replay earlier days
What happened, and what is still promised

Start with the data. Add the answers when you want them.

When cash lands, and what moved.

Book a live demo